Building the future of electric charging together
The transition to electric driving is in full swing. Flanders is taking a pioneering role in this with ambitious targets for both cars and trucks. But how do we ensure that electric driving becomes practically feasible? The answer lies in a well-developed network of charging infrastructure.
And exactly that is the focus of the two-year project in cooperation with the European Regional Development Fund (ERDF) and the Innovation and Enterprise Agency (VLAIO): Designing the optimal network for electric charging in Flanders.
For the first time in recent months, we have brought together all the pieces of the puzzle to calculate the developable capacity per district and municipality in Flanders. This gives governments, grid operators, CPOs and other stakeholders a unique compass to plan future investments in a coordinated way." In doing so, we initially focused on the year 2030.
How did we calculate this developable load capacity?
The core of our methodology lies in calculating the developable capability: the difference between the capability needed to meet future loading requirements (1) and the current, already developed loading capability (2).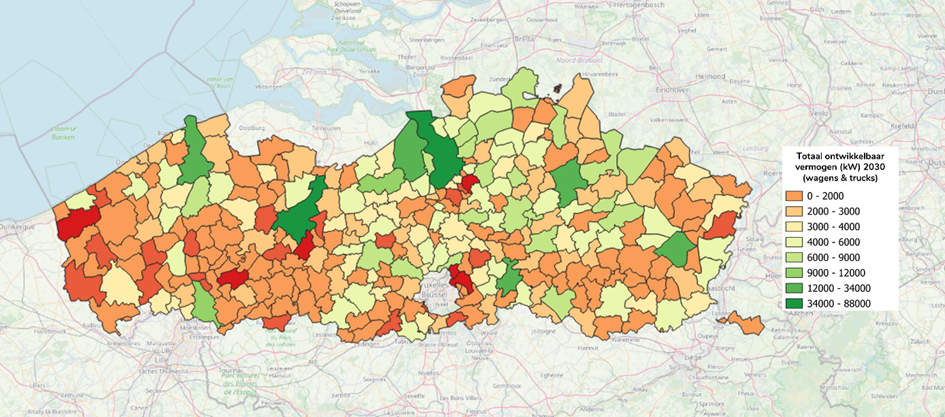
For each district and municipality, the expected need for (semi-)public charging for different types of charging points - normal, fast and ultra-fast charging - was determined. To determine this need, we relied on RetailSonar's unique dataset consisting of location data on:
- Vehicle flows by road segment (for cars and trucks)
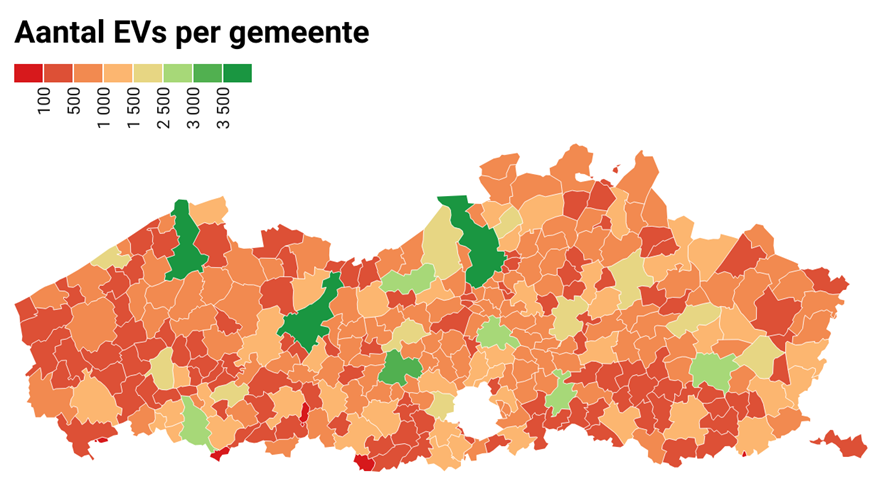
- The expected number of electric carregistrations per district and electric trucks per industrial area and the resulting demand for (semi-)public charging
- Local visitor flows: Other activities and places where charging demand arises. Consider workers with electric cars, tourist attractions, shopping areas and other places
Next, we looked at the existing charging network. Actual data from EcoMovement allowed us to paint a detailed picture of current charging capacity, again by charger type.
Validation and collaboration
A project of this magnitude requires close collaboration. Therefore, our methodologies and results were extensively presented and validated during several sounding board sessions together with delegates from:
- the Department of Mobility and Public Works
- VVSG (Association of Flemish Cities and Municipalities)
- FEBIAC
- Different charging station operators such as TotalEnergies, Engie, Q8, Storm, Opcharge, 50Five, DATS24, Sparki, Hyperfast and Luminus
We also used Fluvius ' capacity indicator to map and evaluate the load per transformer station.
What's next?
In the coming weeks, we will make some further refinements to the methodology and also create future simulations for further years between 2035 and 2050. This will give policymakers, cities and municipalities a long-term perspective on the ideal expansion of charging infrastructure.
We will present the final results of this ERDF project during the final conference on November 24. This will be the moment to discuss the insights with all stakeholders and determine the next steps towards a smart and robust charging network.
![]()


.png?width=352&name=Frame%209%20(1).png)